 Intensity of greenhouse gas emissions;
Credit: Statec
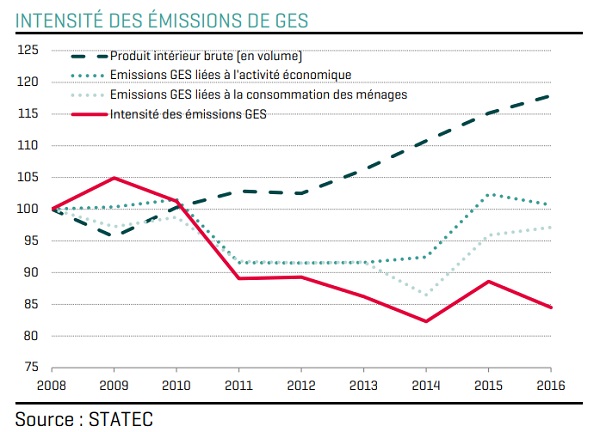
Intensity of greenhouse gas emissions;
Credit: Statec
In a recent report, the national statistical agency, Statec, has highlighted the main indicators of climate change in Luxembourg for the past five years.
In its report, "25 indicators to follow climate change in Luxembourg" ("25 indicateurs pour suivre le changement climatique au Luxembourg"), Statec highlighted 25 indicators that reflect the relationship between human activity and climate change. In order to better inform decision-makers in the implementation of climate change policy, Statec has presented these indicators, as recommended by experts from the United Nations Economic Commission for Europe (UNECE) - and transposed into the national framework.
Four indicators were selected to quantify weather events, namely average temperature anomalies, precipitation anomalies, anomalies related to the number of hot days (ie with an average daily temperature of 30 °C and above) and Unified Degree Day evolution (UDD). In this regard, the report revealed that the last five years have seen the annual temperature increase by 1.6 °C compared to the 1961-1990 period. Similarly, the amount of rain decreased by 5.6% compared to this same period. In 2015, a record year, there were eighteen hot days. In order to highlight a potentially significant impact on Luxembourg, a fifth indicator was added: the level of water stress, ie the proportion of freshwater withdrawals from available resources. Indeed, this level has decreased over the last five years, reaching 2.7% in 2016.
The report listed a further six indicators, as chosen to express the pressures exerted by Luxembourg since 2016: total greenhouse gas emissions, greenhouse gas emissions and intensities of economic activities, direct greenhouse gas emissions from households, emissions from sunlight and the share of CO2 emissions from fuel combustion among the country's total emissions.
Between 1990 and 2017, total greenhouse gas emissions decreased by 23.2% in Luxembourg. These emissions showed a decreasing trend from 1990 to 1998 followed by a bell-shaped evolution with a maximum of 12,424 equivalent tonnes of CO2 (EqCO2) for the year 2005. In 2017, emissions amounted to 9,892 tonnes CO2eq. Over the period 1990-2017, cumulative emissions from Luxembourg amount to 305,013 tonnes CO2eq. Greenhouse gas emissions from fuel combustion for transport represented on average 56.2% of the country's total emissions for the period 2000-2017. Meanwhile, households were responsible for 18% of emissions, with each inhabitant generating three tonnes of CO2.
In addition, the six indicators for monitoring the driving forces focused on the areas of total energy consumption, household energy consumption per capita, energy intensity of economic activities, carbon intensity of energy within the national economy and within households and finally the share of fuel sales to non-residents in total sales. In fact, final energy consumption decreased globally between 2008 and 2015, before rising again in 2016 and 2017, reaching 178,102 TJ. Moreover, household energy consumption per capita decreased by 17.2% between 2008 and 2016.
The next five indicators were selected to quantify mitigation measures, including the amounts received from energy and transport taxes, the average price of carbon, the number of free emission permits, the number of licenses sold by auction and the total consumption of renewable energy. Firstly, the amount collected via energy taxes increased until 2012 before the trend reversed until 2016, reaching an amount of €869 million for the year 2017. The amount of excise duty has not been reduced, although the amount collected via transport taxes has remained between €60 and €75 million since 2007.
The final three indicators concerned the monitoring of adaptation measures with a focus on the water domain, ie changes in the efficiency of water use, household water consumption per capita and the share of water losses among the total amount of water distributed. Over the three years for which figures are currently available, domestic water consumption was, on average, 47 m3 per inhabitant, whilst water losses on the distribution network showed an average value of 3.4%.


