 Credit: IGSS
The General Inspectorate of Social Security (IGSS) has just published its 44th General Report on Social Security for the year 2018; the report presents in detail the evolution of the revenue and expenditure of the various social protection schemes, the characteristics of the beneficiaries, an analysis of the providers as well as the services provided and supported by the various schemes.
Key figures for 2018
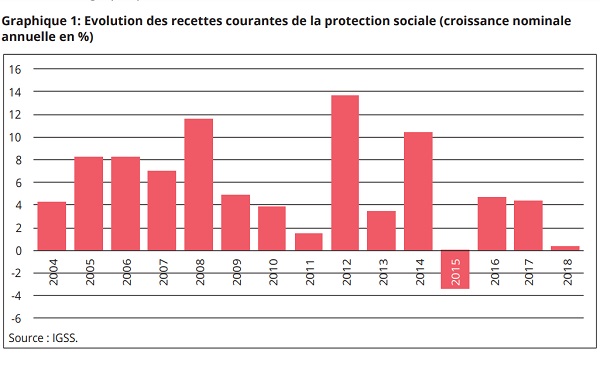
In 2018, receipts from social protection amounted to €13,775 million, up 0.3% over 2017. Current expenditure reached €13,491 million , an increase of 8.4% compared to 2017. The balance sheet for the year 2018 therefore presented a positive overall balance of €284 million, or 0.5% of GDP.
On the benefits side, by adopting the structure proposed by SESPROS (European System of Integrated Social Protection Statistics), the benefits of the old-age / survival function represent, with a share of 39.7%, the largest expenditures of benefits provided by the social protection system in 2018. Then come, in order, the benefits of health care (24.9%), those of the family (15.4%) and of disability (10.7%), which includes disability pensions, accident benefits and annuities, income for the severely disabled and long-term care insurance benefits.
On the benefits side, by adopting the structure proposed by SESPROS (European system of integrated social protection statistics), the old-age / survival benefits represent, with a share of 39.7%, the most important expenses of the whole benefits distributed by the social protection system in 2018. These were followed, in order, by the following benefits: sickness / health care (25.4%); family (15.1%); disability (10.4%), which includes disability pensions, accident benefits and annuities, income for the severely disabled and long-term care insurance benefits.
Unemployment and early retirement benefits and the various employment measures, which form the unemployment function, accounted for 5.5% of all benefits. Finally, benefits from housing and social exclusion madee up 3.9% of the benefits. Over the past fifteen years, this structure has changed very slightly as a result of economic, demographic and / or institutional changes.
On the revenue side, four sources of funding can be isolated: public authorities, including as an employer (52.6%), protected persons (25.9%), employers outside the public sector (21.2 %) and other sources (0.9%), consisting mainly of property income. This distribution applies to the entire social protection system, but each scheme has its own method of financing.
The population protected for the sickness scheme amounted to 858,357 people per year on average for the year 2018. Of these, 69% were individually protected and 31% benefited from derivative rights. Reflecting the particularity of the Luxembourg labour market, which has a significant share of cross-border workers, 64.9% of the protected persons were residents and 35.1% were non-residents. These non-residents contributed to the national social protection system just as they benefit from it.


