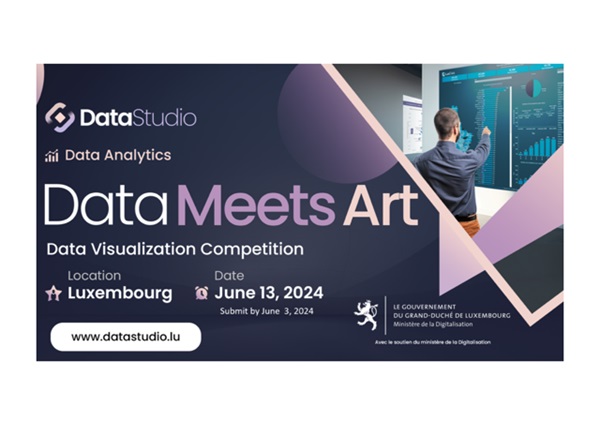
A Luxembourg-based data visualisation competition set to take place on Thursday 13 June 2024 will enable participants to present open data of their choice through eye-catching dashboards or infographics.
Participants can submit their dashboards by Monday 3 June 2024; workshops by Data Studio Luxembourg are available to enhance their data visualisation skills. The organisers noted that this competition aims to promote data analytics and storytelling to a broader audience. Attendees of the event can listen to the presentations and meet like-minded individuals without necessarily participating in the competition.
Open to everyone, the competition covers any topic that can be shared publicly, such as music, politics and nature, using tools like Tableau, Power BI and Google Data Studio.
Categories include interactive dashboards and static infographics, and there will be a special category available for data sonification (the auditory equivalent of data visualisation). An independent jury of data specialists will score entries based on analysis, storytelling and design. Winners will be announced on 13 June, at Casino Luxembourg and on LinkedIn, with the top ten dashboards displayed in a gallery setting.
Chronicle.lu had the opportunity to learn more about this initiative from Steve Albrecht, Founder and Manager of LuxData and Founder of Data Studio Luxembourg.
Chronicle.lu: Please tell us more about Data Studio Luxembourg and its main goals.
Steve Albrecht: Data Studio was established in response to the growing significance of IT and Data Analytics, as well as the existing national skills shortages in these areas in Luxembourg. As a data inclusion, up-skilling and re-skilling initiative, Data Studio aims to advance data literacy in Luxembourg by creating a welcoming and exciting environment for everyone to learn and engage with data analysis. Whether you're a professional or simply interested in acquiring a new skill, Data Studio is here to support you.
Driven by our passion and knowledge of Data Analytics, we are committed to fostering a community where people from diverse personal and professional backgrounds can come together to share experiences and generate new ideas. Through workshops webinars and meetups, the Data Studio is seeking to play an important role in building and shaping a vibrant data community in Luxembourg.
Chronicle.lu: What programme(s) will be used to create the data visualisation models for the competition?
Steve Albrecht: Whether you prefer Tableau, Power BI, Qlik, Google Data Studio, Domo, Dash, Zoho, or Adobe, any of these dashboarding tools can be harnessed to create impactful data visualisations. Whether you're building interactive digital dashboards or static infographics, all forms of visual media are welcome!
Data visualisation is a universal language. Whether you're an expert or a curious learner, the overarching goal is inclusivity, and the three key ingredients for a compelling visual are:
- Data Analysis: Dive into your datasets, uncover patterns and explore insights. Let the data guide your choices;
- Storytelling: Infuse life into your visuals by weaving a narrative. What story does the data tell? Is it one of growth, challenges overcome, or unexpected discoveries?
- Design: Aesthetics matter. Clean lines, harmonious colour palettes and thoughtful layout enhance readability. Prioritise clarity without sacrificing elegance.
Chronicle.lu: Please elaborate on the type of workshops offered to support participants.
Steve Albrecht: We offer monthly workshops and meetups spanning all aspects of data analytics from preparing data, building dashboards, learning through the community, guest speakers and best practice sharing.
At Data Studio, we're passionate about data analytics, and we invite anyone to be part of our vibrant community. Each month, we host workshops and meetups that cover a wide range of topics, ensuring there's something for everyone. Here's what you can expect:
- Preparing Data: Dive into the nitty-gritty of data preparation. Learn how to clean, transform, and wrangle data to make it ready for analysis;
- Building Dashboards: Discover the art of creating compelling dashboards. Whether you're a beginner or an expert, our sessions cover tools, design principles and best practices;
- Learning Through Community: Connect with fellow data enthusiasts. Share experiences, ask questions and collaborate. Our community-driven approach fosters growth and learning;
- Guest Speakers: We bring in industry experts, thought leaders and practitioners. Their insights and real-world experiences add depth to our events;
- Best Practice Sharing: Learn from the best. We discuss proven techniques, tips and tricks that elevate your data analytics game.
Chronicle.lu: Who is the competition primarily aimed at?
Steve Albrecht: Whether you're a data analytics expert, data journalist or a curious learner, anyone can join. Any open data and topic which can be shared with the wider public can be used: music, politics, trade, country facts, nature, sports, social causes, science, etc.
More information is available at: https://www.datastudio.lu/blog/data-meets-art-in-luxembourg-2024.


